Have to say that I am really liking the OAC DV and the custom Plug-Ins that you can easily download and drag and drop the zip file!
I mentioned a few of them in my prior post with the Tree Viz and the Row Expander
This is another custom plug-in that is really fun to use, Dim Player
Again, a few
Easy Prep Steps:
- Navigate using your favorite browser to -> https://www.oracle.com/solutions/business-analytics/data-visualization/library.html
- Click the 'Plug-ins' tab
- Find the Plug-in that you are interested in adding to your set of visualizations
- Download the Zip file
![](https://blogger.googleusercontent.com/img/b/R29vZ2xl/AVvXsEjVzGl2G4_L1A0q3v631p6gCktSWjK1A40ES2WQJkJK0tZEpR6QBYEIOe7AJ4_9QBAqTjDbDDGZlsGVnGV0-baBa1HKjAAOTAEhDNJmR0mAG15Y0jeE20i-u-ebWx26SZqppLHPMrEK_1w/s200/Screen+Shot+2017-11-18+at+12.14.52+PM.png)
![](https://blogger.googleusercontent.com/img/b/R29vZ2xl/AVvXsEiZ1owxNTteSCCrOVDsdhA0bg16lS7kV4naVifukNB02FzYHpDrQopNYGQcc7tL8AiCrz2ohlAd5QLm6znIYUoDFNW5pJRbBt_Kpw7P2Ul55Onx-ndbTatCsmj8byFH5VKEkvRl5JRBf7s/s200/Screen+Shot+2017-11-18+at+12.15.03+PM.png)
![](https://blogger.googleusercontent.com/img/b/R29vZ2xl/AVvXsEiUdxFp-KLKHSESApaD30QDkRcRBvZKqxNpgP0ii1fgHsqesj4ZQycn3FWVNkmKvfyMm73p5lkQYBGXB092gXGOTNE6-aJsPkUt2PIcq73DkuzwkRHFiGIY5uNn9QjNlqpSDs23Y3NL9tQ/s200/Screen+Shot+2017-11-18+at+12.14.37+PM.png)
Here are a few tips to make sure that you are able to properly use this plug-in
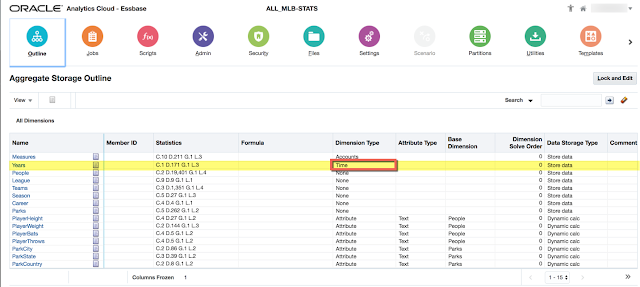
You need to have a Dimension with the Dimension Type = Time (required)
![](https://blogger.googleusercontent.com/img/b/R29vZ2xl/AVvXsEjfCHjyeQ1snLEfMO48RWayebxgm7dwi5HrZ2AumaXy6gd0dXoSGA4oRkFNVyUMlwSL9a9lapC9kZLLYRXl2Y5YmGA-JEAeBIsFYT1VSN5eis2ONXG91-LHA7N3-E4tptfeJbMV6yFfZYI/s640/OAC_MLB_time.png)
Years dimension is shown with a clock 🕒
![](https://blogger.googleusercontent.com/img/b/R29vZ2xl/AVvXsEg4sUA5thlreUATzsEx-n2ybc_dj5SUfgXvF8NFJ_z3XkO26qbExsz0NQSiYB91bXB0il6wsWgRMHJDXAADBGgEGarvfS0neglv3AlN3A0eyg5-ww8QGGhabfWl6iZXf_V_53eL9zqeIvg/s640/Screen+Shot+2017-11-18+at+12.40.20+PM.png)
Start creating your Project, select your dataset(source), visualization.. add measure(s) etc.
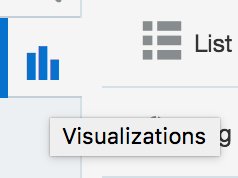
Next you want to navigate on the left menu column and click the vertical bar icon for Visualizations.
![](https://blogger.googleusercontent.com/img/b/R29vZ2xl/AVvXsEiwf0UmSAizZwePyirKwV75WyGq4Hb8J8QM-XrtmPElzX8UoIf0x6msuNapRZPrLXz2uCCfhyphenhypheniicbytDrB-YQETEKdTDSoZAI2TU32iQSdjyWDuEGOnmpFRcqVT5-max2B9e2kDkDj8Ul8/s400/Screen+Shot+2017-11-18+at+1.06.20+PM.png)
Scroll to find your next viz to add, in this case DimPlayer, drag it onto your canvas
![](https://blogger.googleusercontent.com/img/b/R29vZ2xl/AVvXsEh2BsHkVRbiS0kd-0tJ5nzXUZXVEtP809Lhw4zsG4ktWqxHOhH_Gv17pFFA-2Xmbb054e4gQDElvuxliNRZcjj3ZjoIkME3Ute-wfg0SQd60lJB0eIcjwrhEcrG643z3lLjLqmA7AWfmoY/s320/Screen+Shot+2017-11-18+at+1.08.02+PM.png)
The magic of this plug-in is that it uses the Time tagged dimension as the Play Axis
![](https://blogger.googleusercontent.com/img/b/R29vZ2xl/AVvXsEh3biLpG5ZxqOy8Ave-OrvxIJRYqduDrZYxozkib_J_CTLGs7sKFhPHUegJ8L5pSbC3hdHwK9sT2G6x286c7myf7Va7C62cBoFwD9TSn5HObm1W7g387n2L8iG6tw35xIrAEh0JqShNp80/s320/Screen+Shot+2017-11-18+at+1.07.23+PM.png)
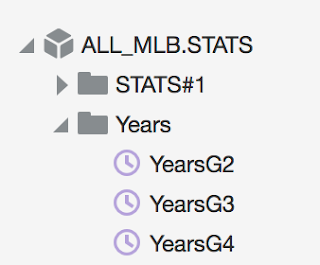
In my MLB cube, I have the Years dimension, drag the desired Generation in as the PlayAxis
![](https://blogger.googleusercontent.com/img/b/R29vZ2xl/AVvXsEh9sb_nsEroRt_ObiYN7o2xiMlfGQkveHcOG0A5PP2uSaRzW_hSqEbwBAC_W0tukHzrAGvZ4kyT5tA0gC0arQ_uIIiiVYTnV7Ltv1T8a92vXOQ3mw_e10k1reD3RBYbrpo3aF3Q257Sa-w/s320/Screen+Shot+2017-11-18+at+1.07.39+PM.png)
But we are not ready. We need to ensure a few more items.
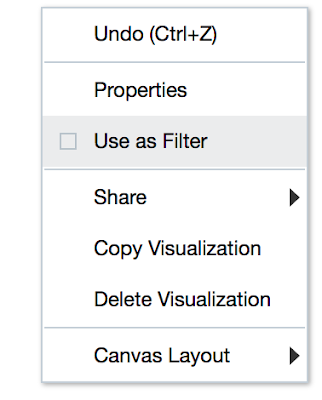
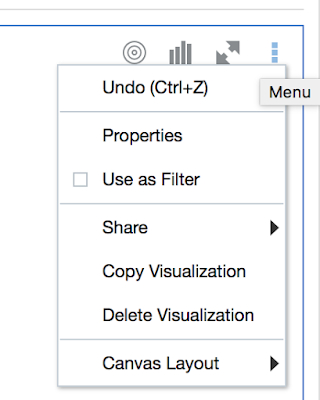
Open the 'menu' of this newly added viz.
![](https://blogger.googleusercontent.com/img/b/R29vZ2xl/AVvXsEg_d1I-qmPXholoqmbb9aqB0o6rtvc3eG7JKMUTgHZ_RUmoejt7cyurn2y3xEskm0LOOGm7PEwb4F8ULsqdafeSvuOuBY8OCdhFx6HJTUgJ_btvYARycA-dgnAygzldThjjxlZ8JHC4OzA/s400/Screen+Shot+2017-11-18+at+1.08.20+PM.png)
Click/check ' Use as Filter'
![](https://blogger.googleusercontent.com/img/b/R29vZ2xl/AVvXsEjDsLdg7SEEBZL9Rc6Kp0zwc6XPdsKGjHvU0cGCN0-GdOT-I-sE084h7uiqHA8RFTbYMBip8ScMuDenz6LDVYZOJ01qxAeQK2AT8-dFqiI7kTm30vZoJrwicE-7Dq_Cf9TZTtv29uuMfXU/s400/Screen+Shot+2017-11-18+at+1.08.11+PM.png)
You also have the ability to change the speed of the refresh rate of the viz, just use the interval and key-in +/- the # of seconds you would prefer.
![](https://blogger.googleusercontent.com/img/b/R29vZ2xl/AVvXsEg9Pbx2SbWAY6qAb9NJb3W99KuLLJaPQZ9ecpZwQhRyrb-3_Fw3nUAMtdg41Pov3tOYDlrDc436xShvrzK5M8icmb5eJswWaYY6J-aRYuvjEXwdIoi8TforHfpE2JicBTicMy-DxYrV8iE/s640/Screen+Shot+2017-11-18+at+1.08.02+PM.png)
You are now ready to Just.Hit.Play
All of the MLB Homeruns hit over time in approx. 1min!
No comments:
Post a Comment