Showing posts with label Custom Plugin. Show all posts

Wednesday, May 15, 2019

Available to download - Oracle Data Visualization Custom PLUGIN Butterfly

Excited to announce that a 3rd custom PLUGIN I have been working on is available to download and start using now - available on


The Oracle Analytics Library: https://www.oracle.com/solutions/business-analytics/data-visualization/extensions.html


Within the Extensions tab


or download here


Name of Viz: Butterfly Chart

Authors: G.Adashek & D.Flores


Description:

The Butterfly chart, also sometimes known as a tornado bar chart allows to compare 2 data sets side-by-side.
This provides a quick analysis of variances and is a simple comparison chart.
Use the tooltip in this custom viz to easily show the variances.


Saturday, March 23, 2019

Available to download - Oracle Data Visualization Custom PLUGIN Vertical Waterfall

Excited to announce that a 2nd custom PLUGIN I have been working on is available to download and start using now - available on

The Oracle Analytics Library: https://www.oracle.com/solutions/business-analytics/data-visualization/extensions.html


Within the Extensions tab

or download here


Name: Vertical Waterfall

Authors: G. Adashek & D.Flores

Description:

The Vertical Waterfall is the ‘tipped’ (top-to-bottom) version of what many know as the traditional horizontal (left-to-right) Waterfall chart. 

By rotating the visualization 90 degrees clockwise, this allows for easy to read text along the y-axis spine of the visualization.


Monday, August 6, 2018

Available to download - Oracle Data Visualization Custom PLUGIN "Elbow" Dendrogram

Excited to announce that a custom PLUGIN I have been working on is available to download and start using now - available on

The Oracle Analytics Library: https://www.oracle.com/solutions/business-analytics/data-visualization/extensions.html

Within the Extensions tab

or download here


Name: "Elbow" Dendrogram

Authors: G. Adashek & D.Flores

Description:
The “Elbow” Dendrogram creates a hierarchy based Parent-Child like structure with ‘links-arms’ that are bent at a 90° angle. This plugin can render a #measure element and is zoomable.

Sunday, April 29, 2018

Spring Fever .. OAC .. Major League Baseball

It is that time of year again --

when spring is upon us
the snow starts to melt
the birds chirp outside the window in the morning .. 
and the Major League Baseball season begins ⚾

As I am getting ready for presentations, I wanted to share a few neat visualizations .. a little bit of a sneak peak.

CAN'T WAIT for anyone who wants to attend to see the full finished product!


Custom Plugin CollapsibleTree

WITH DATA (#measure)


WITHOUT DATA (#measure)


This is still one of my favorite visualizations!

DimPlayer is my favorite combo visualization!


And now that the 2018 MLB season is underway, it is time to update the ALL_MLB_STATS Essbase cube with 2017 data :)


A nice night & weekend little project is about to get started!! Stay tuned


Thursday, February 15, 2018

OAC - Essbase .. WRITEBACK via OAC - DV!!

OAC - Essbase WRITEBACK IS ALIVE!


Well, the day has finally arrived, Essbase Writeback in the cloud is real .. and a thing 😎🤓🤓😎


Let's get into the how-to and what it looks like.


But first, a BIG shout out to Gary Crisci for being able to battle the patch frontier and slay the OAC demons!


OAC - Essbase patched to version 109 .. skipped right over 108 to specifically Version 12.2.1.1.109 - Build 126
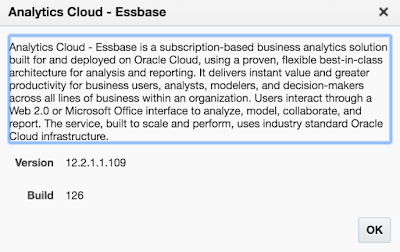


Steps to success


  • Create an Essbase cube in OAC (thought that this step and a few others might be obvious ..)


https://www.oracle.com/solutions/business-analytics/data-visualization/library.html


  • Find the Custom Plug-In: Essbase Write-Back plugin by Oracle
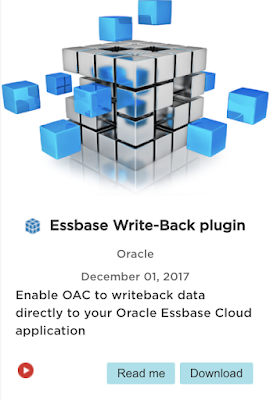


  • Click Download to Download the zip file


  • Log into the OAC - DV/BI instance


  • Go to Console


  • On the panel, click Custom Plugins


  • Upload the saved Custom Plugin from the step above, drag and drop or click "Upload Custom Plugin" and select the zip file


  • On the panel, click Safe Domains


  • Click, "add domain"


  • Domain Name: enter * (wildcard)
  • Check all of the boxes: Image, Frame, Script, Font, Media, Connect


  • Sign Out of OAC DV/BI
  • Sign back into OAC DV/BI
  • Navigate to Data Sources / Create / Connection / Oracle Essbase (Beta)
>>> When does this Connection Type not say (Beta)! <<<


Connection Details:

*New Connection Name: "Your Essbase Server"

*DSN: IP or host:Port /essbase /agent
ex. http://my.IP.address:80/essbase/agent

*Username: <AdminUsername>

*Password: <AdminPassword>

*Authentication: Always use this credentials??

  • Click 'Save'


From the OAC - DV/BI Home

  • Click Create .. Data Set ..
  • Select the Newly created Connection
  • Select the Essbase Cube that is a part of that Connection that you want
  • Click 'Add'


You should see a notification "The Data Set was successfully saved."


  • Now go ahead and create a Project
  • Select the cube you added as a Data Source of the "Essbase Server" above
  • Create your visualization adding the dimensions .. ALL of the dimensions
  • Change the Visualization..


  • Select the "Essbase Writeback" Viz


Now your Viz looks more like a reporting grid 😀 .. go ahead and double click a data cell .. and enter/change data .. Click 'Submit'


In this case I changed Sample Basic
Budget Sales May 400-10 Wisconsin from 90 to 100


Nice to see the cell change color to the muted yellow similar to either Workspace or Smart View

You should now get an inline popup window that is asking to re-validate the credentials in order to accept the data change being submitted to the cube..


Target Database Detail:
Should all be the same credentials that were used above
ex. http://my.IP.address:80/essbase/agent
*Username: <AdminUsername>
*Password: <AdminPassword>

  • Click 'Fetch'
  • Click the dropdown arrow for Application and make your selection
  • Click the dropdown arrow for Database and make your selection
  • Click 'OK'

.. and your grid should "Refresh" .. wait for it

and now be updated with the new data value(s) saved in the cube!!!!


Coming soon .. a blog post about the latest version of

Cube Designer Version 12.2.1.1.109 Build 126