Query Designer can be used for both Essbase & HFM data sources!
At a high level, query designer allows users to design queries from a default reporting grid. Or extract the query from an existing report. Or create and run MDX queries. And provide the ability to share a query by simply saving and sending to another user, just like any other Smart View workbook.
Let's take a look.

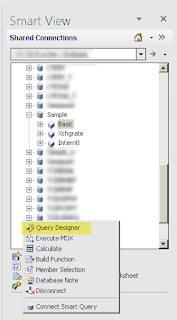
Query Designer can be found in a few places. From the Essbase Ribbon once an active connection is established. Or from the Connection Panel.
In this example, we are using Sample Basic.
Once Query Designer is selected, a few things happen.
First, a new worksheet within the same workbook is created.
When this new sheet gets created you can observe..
The new sheet makes a copy of the sheet where the connection has been established and appends " - Query" to the sheet name. This is highlighted in the screen capture in Yellow.
In addition, there is now a panel that appears with the POV consisting of the query (report) Columns, Rows, POV and any attributes if applicable.
By clicking on the Columns or Rows Dimension Names below each, you get to the Member Selection window and can proceed like usual. Or you have the ability to create dynamic query criteria.
In this example, we want only the level-0 members, of the Year dimension, to appear on this report. By selecting the Dimension-Member "Year" we can then either click on the drop-down for the filter or use the "right >" drop-down to apply a dynamic query to only, and always bring back all level-0 members.
This is a powerful feature. This allows for members to be added or removed from the database-application-outline-dimension without having to modify, your existing query (report) to ensure that you have the proper members and/or result set.
When you click OK.
This is the result in the Excel grid.
By making a few more selections for the query, measures, scenario, etc. the query is now ready based on the design you have provided.
To send the query and retrieve data. Click the button 'Apply Query'.
Once the query is 'applied' a few things happen
1) The query designed is sent to the server.
When the query is complete the result set retrieved is ready to be delivered back to the workbook.
2) The sheet with " - Query" appended is hidden within the workbook.
3) And a new sheet is then created with " - Report" appended
instead of " - Query"
Now, let's modify this query to make it even more dynamic and specific.
We want results for Market parents, East, West, South and level-0 of Central.
Notice how in the member selection, selected window, there is now a plus sign next to the member Central and also with syntax ", Level, 0" trailing the member.
Note: If you also wanted to show the Central total, you could also member select that into the selected members window pane, in addition to the level-0 members of Central. This is a great way to create a dynamic report that uses the query designer to now provide a natural Subtotal or validation check of the details in the report, making sure the parts equal the total in this case.
Let's see what the grid shows.
The syntax is also now added to run the query designed for Markets.
Once again, 'Apply Query'. The "Query" sheet hides. And the "Report" sheet re-appears with the designed, requested query and the set of data results.
A few more fun things to note.
a) If you would like to edit-modify a query already built using query designer or an turn an existing report grid into a query designed report.
Simply go to the Ribbon button 'Query' and select 'Query Designer'. Either the pre-existing 'Query' sheet will re-appear or a new 'Query' sheet will be created.
b) If you are comfortable with the syntax the query designer provides in the sheet "Query" on the Excel sheet-grid. You are able to free-form type in the desired query. Make sure you have the syntax correct, if not, Smart View will throw an error that there was an error in the syntax detected and attempt to tell you where is possible.
c) Once the Query Designer results have been retrieved. This new sheet can be used like any other Ad-hoc analysis worksheet.
Note: If when using Ad-hoc analysis on a query designer 'report' this is now a desired report I would suggest that you use the Excel functionality of making a copy of that worksheet. If you don't, and the query designer is again going to be used, this report will be overwritten with the newly requested result set of the query.
Many times users describe reports that they have created and are concerned about having to redo and spend time when members as mentioned get added and or moved. Or when the member description-alias is updated. In these cases, query designer is a great way to ensure that the report and the desired results are accurate and dynamic to pick up changes without having to re-create reports from scratch or get Smart View Ad-hoc errors that members or description-alias are not recognized, etc.


