It has not been that long since the Halloween 👻 💀 🎃 holiday season.
So let's have a little trick or treat spirit to this blog post shall we.
And in that spirit, we will only be getting tips and treats and less on the tricks. 🍬 🍭 🍫
Let's begin.
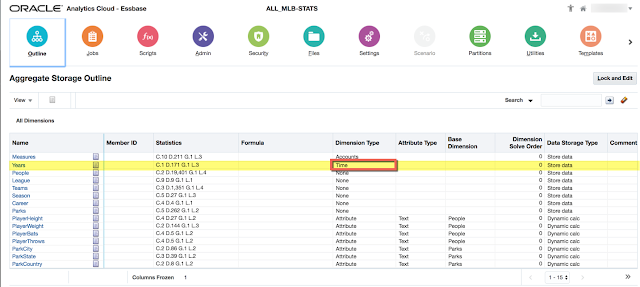
As per one of my prior posts, I was able to 'connect' OAC DV/BI to OAC -Essbase and the amazingly fun Major League Baseball cube (And Yes I owe a few of you a copy of the Oracle Cube Designer for Excel model)
🍬 Fun Fact: the format for these Workbooks is called DBX format (Structured Excel)

🍭 It is also worth mentioning that there is also a New version of the
Cube Designer Extension available to download and install;
12.2.1.1.108 Build 117
There are a few updates to note in this version:
- Member Formula validation
- Hierarchy Viewer Duplicate Member Outline Support
- Transform Data enhancements
Moving on. OAC DV/BI
I will be using the MLB STATS cube that I created to share my examples.
I noticed that there are a number of Visualizations already available, nice, but there are also more Plug-ins that can be easily download/uploaded for your use as well.
Easy Prep Steps:
- Navigate using your favorite browser to -> https://www.oracle.com/solutions/business-analytics/data-visualization/library.html
- Click the 'Plug-ins' tab
- Find the Plug-in that you are interested in adding to your set of visualizations
- Download the Zip file
🍫
Next Steps within OAC DV/BI:

Login ;) -> http://<your IP address>/va/?pageid=home
Click 'Console'

Click 'Custom Plugins'

Either 'Upload Custom Plugin' or drag-and-drop the downloaded zip file into OAC

Time to create your New Project and add one of these newly added Custom Plugins
One of the ones that I recently got feedback "That is REALLY cool!" was the use of the 'Collapsible TreeViz' Plugin.


This Plugin does NOT require a #Measure! Take a look.
This example was for the MLB World Series matchup between the Dodgers and the Astros.
Looks like the list of Teams aligned to the Active Franchises of the Dodgers is 9 and the Astros is 3.
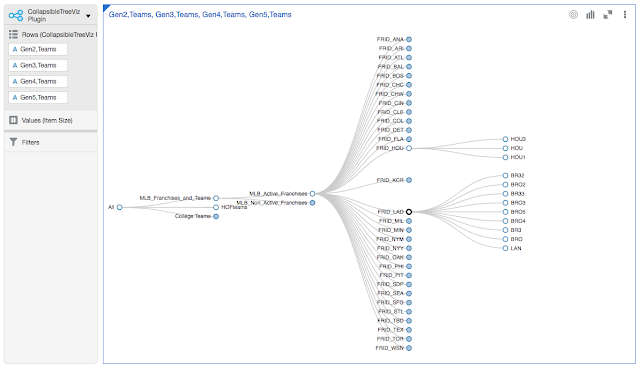
This in my opinion IS REALLY COOL!
Wonder what it would look like against DRM?!?! I might need to create that as a Data Source.
Another Custom Plugin that I added was 'RowExpander'


There are times in DV that I want to see my data easily in an expandable Tree View (Hierarchy). My dataset is naturally 'built' that way in Essbase. And I want an easy way to navigate my dataset accordingly.
To simplify my example, I filtered the data to only include Players that Last Names begin with 'AA'.
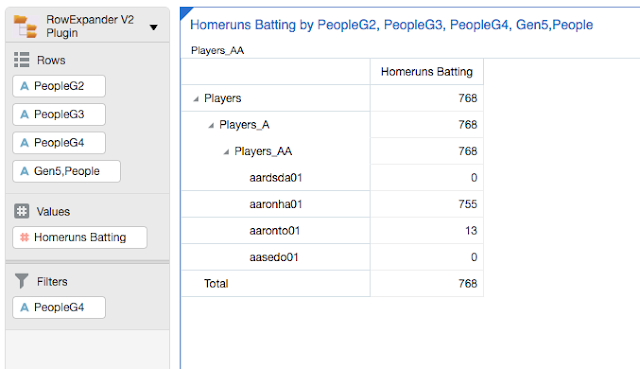
Notice that there is a 'carrot-arrow' symbol '>' next to each row member that is available for expansion. This makes me feel a little nostalgic and creating HFR reports .. checking the checkbox to 'Allow Expansion'. Maybe it is just me and the good ole days of learning to use it, and, well .. since it has stood the test of time of it's look and feel of 1997 .. But I would like to have HFR available in OAC to create highly structured and formatted reports, books and even batches, that is, at least for Essbase, Planning, or other EPM datasources created in OAC. One can only hope, although, HFR is now only Web version supported and no more desktop client installer (HFR desktop client install, you were my nemesis! Hope you rode off into the sunset of product installers well my friend). I digress.
So, for me the Player above with 755 Career Homeruns is obvious. Do you know who this MLB Player is?
Another Fun Fact in closing this post.
In order to see my Viz/analysis via Smart View, I needed to create Reports using the Classic OBIEE Designer.

Only then was I able to create a Smart View connection, see the repository and add these objects into Office (Excel, PowerPoint, Word).
Until next time. Stay safe while using OAC. Your Alias Table(s) might not be 👻 😞 🙁 👻
